
Looking beyond the default to get a more accurate measure of visitor behavior
A content marketer has a wide array of metrics available to measure the performance of a content program. These metrics can provide answers to two key questions regarding user behavior:
- How many visitors see the content?
- Do visitors like the content?
The answer to the first question is easier to find as there are tracking tools that measure the number of visitors, visits and page views on your website.
Answering the second question, however, is a bit more difficult because this information has to be interpreted using visitors’ online behavior. The amount of time spent on a page is one key metric that can help. Generally speaking, if visitors spend more time on your website, they are more likely to be actively consuming your content.
In this article, we’ll dig deeper into the time on page metric, especially as implemented in Google Analytics (GA). We will also share an alternative measurement that aims to overcome these challenges.
HOW MUCH TIME DO VISITORS SPEND ON YOUR WEBSITE?
In its default implementation, Google Analytics answers this question by providing the average session duration and the average time spent on a page. With more advanced methods like the Query Explorer or data pull through Google APIs, you can also get the total time spent on a page across all visitors and visits.
These are valuable metrics that can be used to identify trends in site and page engagement. However, they can be flawed and don’t always provide a complete picture of actual engagement levels.
HOW IS TIME SPENT ON A PAGE CALCULATED IN GOOGLE ANALYTICS?
This measure is slightly more complicated than regular awareness metrics such as page views or visitors. Time spent on a page is essentially a measure of duration bookended by two actions:
- A page gets loaded.
- The page eventually gets closed or replaced by another (or the session times out).
All time spent calculations are therefore a difference between the time stamps of two actions on the site.
One major issue with this relates to exit pages (more on that below), and another pertains to the tabs visitors have open in their browser that they are not actively engaged with. Yehoshua Coren has some great ideas for addressing these issues. What we deal with in this post is the issue with exit pages.
Some good sources to get a more in-depth understanding of this particular GA function include Google’s help pages, this classic post by Justin Cutroni and another by Analytics Edge. These posts will also bring to light some of the issues with Google’s default implementation.
- The importance of exit pages
The last page of a visit to a website is called the exit page, and it has a big influence on how time on page is calculated. When a visitor closes a tab or navigates to another site from a page, that page is marked as an exit page.
The number of times visitors exit a particular page divided by the total page views gives you the exit rate for that page — it tells you how likely the visitors are to end their journey of your site on a page. If you run an e-commerce site, for example, the final “thank you” page after checking out a product would be a likely candidate for a high exit rate as most visits would end there.
Looking at exit rate values is important for scenarios where the goal is to have visitors follow a certain path and helps you analyze if they are dropping out at unintended stops in this journey.
- How exits influence time on page
Now we get to the heart of the matter. Pages with a high exit rate have time on page values that fluctuate a lot. An exit from a page doesn’t provide that second time stamp GA needs to calculate the time the user spent on the last page. Sessions and page views without additional engagement officially log as 0:00 in Google Analytics, whether the user spent two seconds or 20 minutes on the page.
The standard implementation of GA lacks any custom events to regularly ping GA to record the time spent values that can be used in case of an exit. And even if such events are added, the formula GA uses poses another problem.
Avg. Time on Page = Total Time on Page/(Total Page Views — Total Exits)
The denominator here is a bit unusual: The total time on page is not divided by total page views, but by a reduced number. It’s like calculating miles per gallon to measure your car’s fuel efficiency and dividing the total miles driven by fewer gallons than you have pumped into the car. The result will be inflated.
GA is essentially removing your exit pages from the average time on page calculation. Because of this inexact measurement approach, you can’t be sure of the time spent on exit pages, so it’s better to limit the calculation to non-exit pages.
Many analysts track multiple user interactions on the website to build a more comprehensive picture of user behavior. For example, if you track scroll actions, you gain this additional information about time spent on the page even if it is the exit page of a visitor’s session. You can also regularly ping GA from a page to consistently update the time the user has spent on the page. These are called timer triggers, and you can read more about their implementation in this helpful blog here.
All this information adds to the numerator of the above formula. Subtracting the number of exit pages from the denominator leaves you with some really high values for average time spent on a page (for example, 25 minutes on a page with a 500-word article).
- Examples of this inflated average time on page
Below is one instance where a high exit rate inflates the average time on page as calculated by GA.
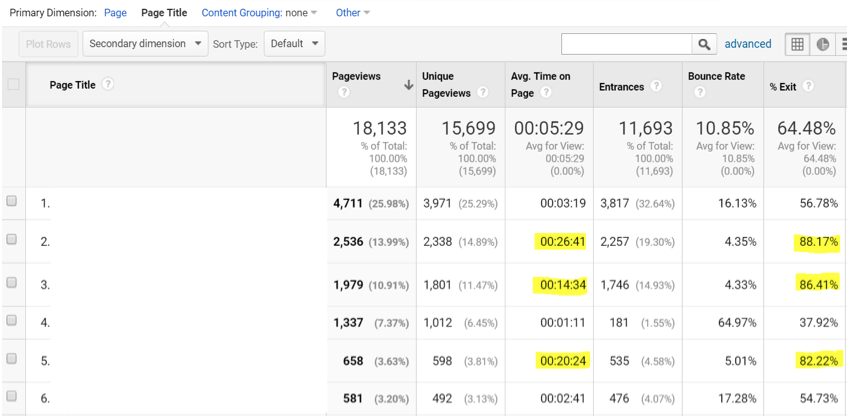
Consider page two on that list — the one with 2,536 page views. An 88.17% exit rate implies 2,236 exits. In other words, the average time on page calculation for this page is based on only 300 pages. It’s no surprise then that GA calculates this value at 26:41 minutes for this non-video, all-text page.
A MORE ACCURATE WAY TO MEASURE AVERAGE TIME ON PAGES WITH ADVANCED TRACKING
Here is one solution for this issue of odd-looking time values. As the issue lies in GA’s formula, we decided to create our own formula. GA lets you do this through the “Calculated Metrics” feature under “View.”
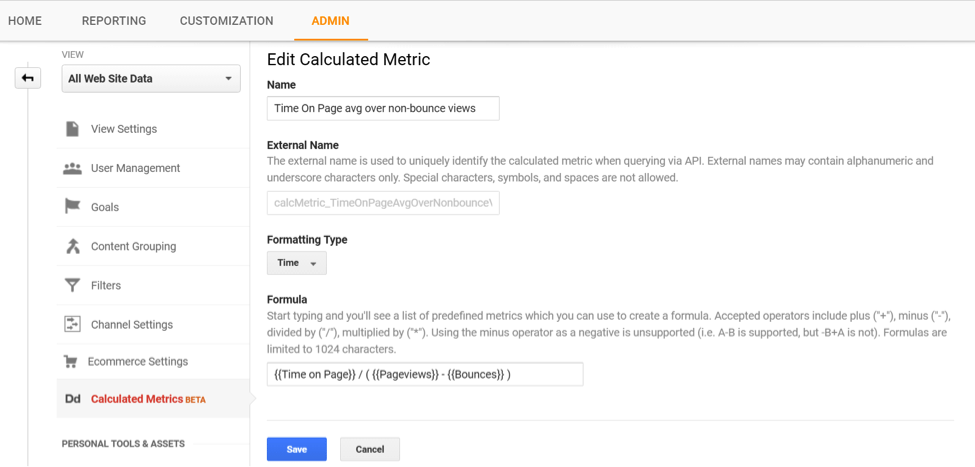
The formula, as you will notice at the bottom of the image, makes use of GA’s built-in variables including:
- Time on Page: This is the same numerator as in the average time on page calculation.
- Pageviews: This gives you the total page views (for one page or a collection of pages, as chosen in your report).
- Bounces: This represents the total bounces recorded on a page and is the only difference from the default formula. In this implementation, we have defined a bounce as a visit lasting less than 10 seconds and have set up timer events to calculate the time a user remains on a page. Rather than discarding all the exit pages from our calculation, we’ve only removed the bounced page views. In a nutshell, what GA intended to do with exits, we limited to bounces.
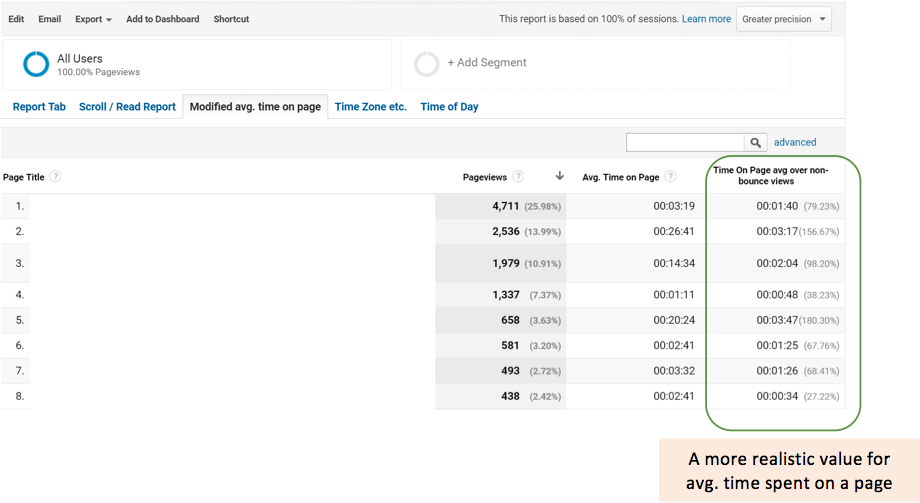
A CUSTOM REPORT WITH MORE ACCURATE DATA
Here is a custom report that compares GA’s default average time on page with our modified calculation. While the page names are hidden for privacy reasons, you can match the data with the previous report by looking at the page views. As you’ll notice, the modified time on page in the last column has more realistic values now.
While tools such as GA provide rich data for marketers to review the success of their content, it is important for marketers to understand how the data is calculated in the system, identify the limitations and, when possible, develop custom metrics to uncover more accurate data.
Calculated metrics is a great feature of GA that offers such customizations for more accurate reporting. As the formula, in this case, involves three default metrics of GA, the calculation is also effective retrospectively — the value is calculated for the period prior to the implementation of this calculated metric as well.
Such retrospective calculation isn’t available in other GA features such as Goals or Custom Dimensions. Whenever a goal is edited in GA, the data captured up to that point isn’t recalculated to reflect the update. But our implementation of custom metrics provides historical data even for pages that have been pulled off your website.
–––
The true value of a Google Analytics and Google Tag Manager implementation is only unleashed when it is customized to extract more information about how visitors interact with the website. With any such customization, you have to be careful about how to interpret KPIs.
While the default average time on page will work for most situations, it falls short in situations where a page has a high exit rate. The modified calculation shown above helps you extract a more accurate reading of the time that visitors spend on your pages and enables you to make more informed decisions.
If you have not done it yet, implement a way to ping the GA server to update time spent on a page, as outlined in the multiple blog posts that are mentioned above. Once you have that ready, implement the calculated metric in GA to find a more accurate value for the average time spent on a page.
Have any suggestions, tips and tricks of your own to enhance a GA/GTM implementation? Or is there a misunderstood metric that you would like to tell us about? Leave a note in the comment section — we would love to have a conversation.